The most successful restaurant operators in 2026 share one characteristic: they make decisions based on data, not instinct. They know which dishes are most profitable (not just most popular). They know which hours drive the most revenue. They know their food cost percentage in real time — not after month-end reconciliation.
This is the promise of restaurant analytics and reporting — and it is only achievable with a POS system that captures, organises, and presents your operational data intelligently.
This guide covers the analytics and reporting capabilities that every restaurant needs — and how VendorKeeper's real-time dashboard and smart reporting delivers them all.
Why Restaurant Analytics Matter More Than Ever
The restaurant industry's margin environment is brutal. Food costs are rising. Labour costs are rising. Rent is rising. In this environment, the restaurants that survive and grow are those that optimise relentlessly — and optimisation requires data.
Without analytics, a restaurant owner is flying blind:
- Is Tuesday lunch profitable enough to justify the labour cost?
- Is the Truffle Risotto (the most ordered item) also the most profitable?
- Which branch of the chain is underperforming — and why?
- What is happening to food cost this month versus last month?
- Which staff member generates the highest average transaction value?
With VendorKeeper's analytics, every one of these questions has a real-time answer.
The Real-Time Dashboard: Your Restaurant at a Glance
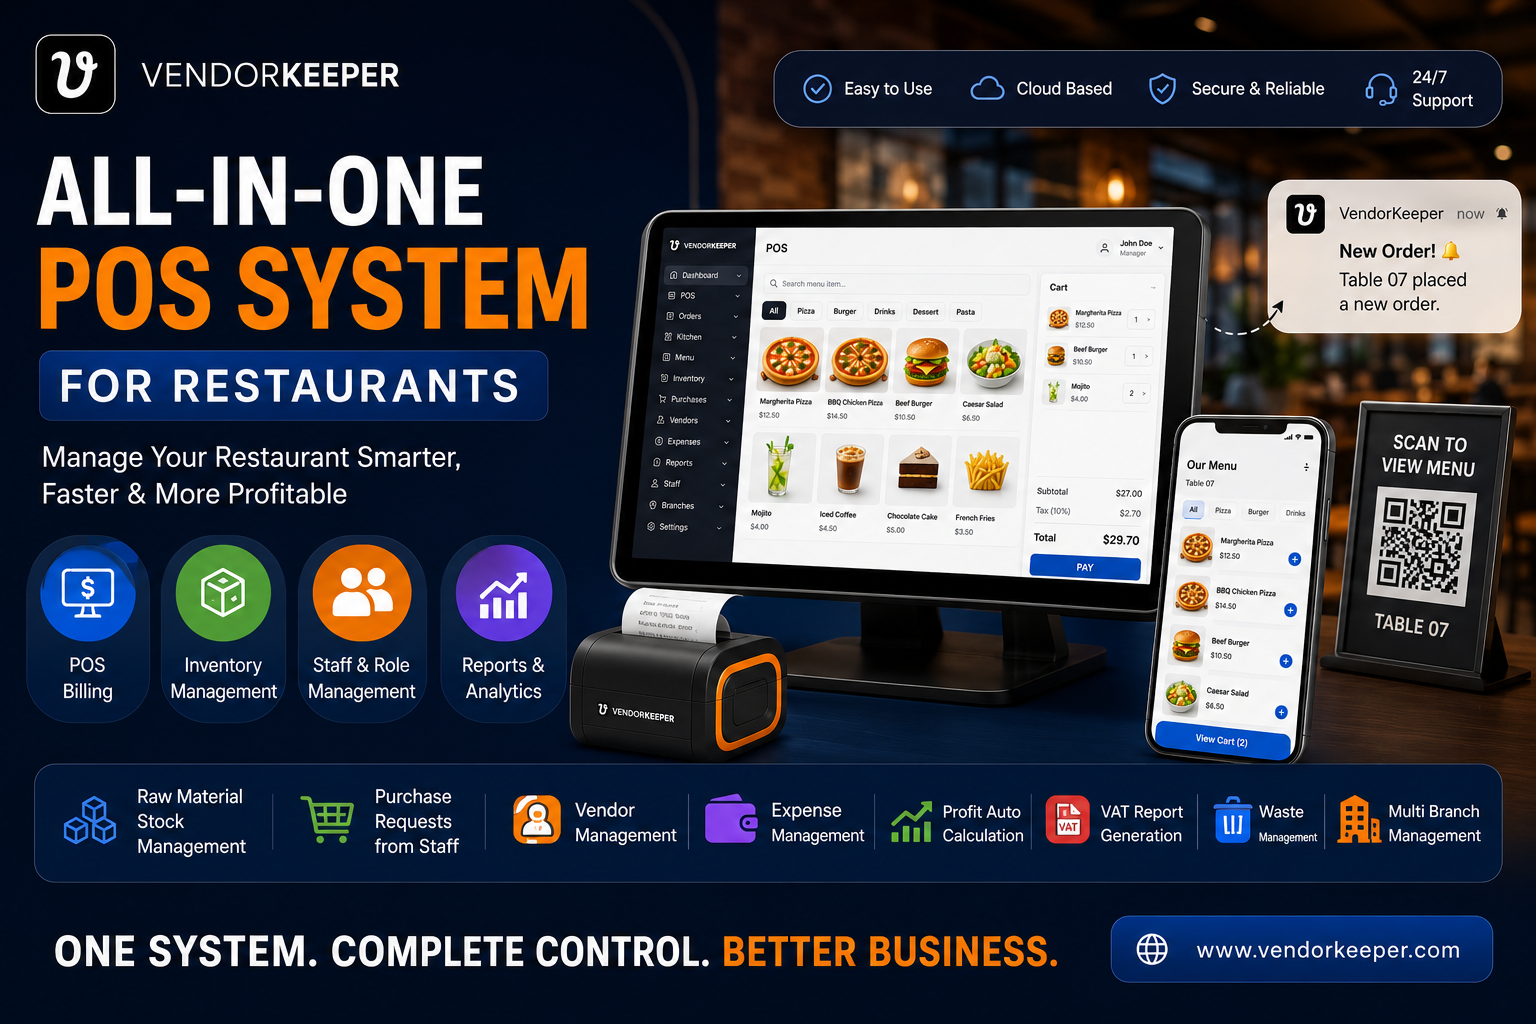
VendorKeeper's real-time dashboard is the starting point for every management interaction with the system. It displays — updated live, with every transaction:
- Today's revenue: Running total from the moment service opened
- Today's covers: Number of transactions/tables served
- Average transaction value: Revenue divided by covers
- Best-selling items: Top 5 by revenue and volume — updated in real time
- Hourly sales pattern: A live chart showing revenue by hour — revealing your peak periods
- Current stock alerts: Any ingredients currently below minimum threshold
- Pending vendor payments: Due amounts owed to suppliers
This dashboard is accessible from any device, anywhere — meaning the owner can monitor their restaurant's performance from home, from another country, or from the restaurant floor.
Sales Analytics: Understanding Your Revenue
Sales by Time Period
VendorKeeper generates sales reports for any time period:
- Today, yesterday, this week, this month, this year
- Custom date ranges (e.g., "last quarter" or "Ramadan period vs non-Ramadan")
- Year-over-year comparison — track growth or identify seasonal patterns
Sales by Category
Break down revenue by menu category — appetisers, mains, desserts, beverages, restaurant. Identify which categories drive revenue and which are underperforming.
Best-Selling Products
VendorKeeper's best-selling product report ranks every item by:
- Total units sold (volume champion)
- Total revenue generated (revenue champion)
- Total profit contribution (profit champion)
These three lists are often different — and the gap between them is where menu engineering opportunities lie.
Sales by Service Mode
Compare dine-in vs takeaway vs delivery revenue — by day, by period, and as a percentage of total sales. If delivery is growing but margins are lower (after platform commission), this data makes the case for investment in in-restaurant QR ordering.
Sales by Staff Member
VendorKeeper tracks which staff member processed each transaction — enabling a report on revenue per server or cashier. High-performing servers who consistently upsell can be identified and incentivised.
Financial Analytics: Profit, Cost & Cash Flow
Profit Auto-Calculation
VendorKeeper calculates net profit automatically by subtracting:
- Cost of goods sold (based on ingredient costs × quantities sold)
- Logged expenses (utilities, wages, maintenance, marketing)
- Logged waste and damage costs
The result: a real-time profit figure that management can check at any point during or after service.
Expense Tracking & Reporting
Every expense is logged in VendorKeeper with category (utilities, labour, maintenance, marketing, rent), amount, date, and responsible staff member.
The expense report breaks down spending by category for any period — enabling budget variance analysis and cost reduction planning.
Cash Flow Tracking
VendorKeeper's cash flow report shows incoming revenue and outgoing expenses in a unified view — making it possible to identify cash shortfalls before they become crises.
Profit/Loss Report
The P&L report brings together revenue, COGS, and expenses into a formatted summary ready for your accountant — reducing month-end close time from days to minutes.
Inventory Analytics: Stock Intelligence
Beyond the real-time inventory count, VendorKeeper provides:
Consumption Analysis: Which ingredients are consumed fastest? (Informs purchasing frequency.)
Variance Report: Difference between theoretical consumption (from sales) and actual stock reduction — identifying waste, theft, or supplier shortfalls.
Supplier Performance: Volume and value of purchases per supplier — supporting negotiation and alternative sourcing decisions.
Multi-Branch Analytics: Group Performance
For restaurant groups, VendorKeeper's group analytics are the most powerful management tool available:
- Branch comparison: Revenue, covers, average spend, and food cost percentage for each branch in a single view
- Group best-sellers: Which items perform across all locations? Which are local-only successes?
- Staff performance by branch: Identify high-performers and replicate their practices across the group
Exporting Reports for Accountants & Stakeholders
Every report in VendorKeeper exports to PDF or Excel — ready for:
- Your accountant or CFO
- Investor or lender presentations
- Tax authority submissions
- Internal management review
FAQs: Restaurant Analytics & Reporting
What analytics does a restaurant POS provide? VendorKeeper provides real-time sales analytics, best-selling product reports, staff performance tracking, food cost and profit calculation, expense reporting, inventory analytics, and multi-branch comparison — all in one dashboard.
How do I know which menu items are most profitable? VendorKeeper's product analytics rank items by revenue, volume, and profit contribution — enabling menu engineering to promote high-margin items and remove low-margin underperformers.
Can I see my restaurant's real-time profit? Yes. VendorKeeper automatically calculates net profit in real time — subtracting cost of goods sold (from ingredient costs) and logged expenses from total revenue.
How do restaurant analytics help reduce costs? Analytics identify over-purchasing patterns (from inventory variance reports), high-waste categories (from waste logs), and underperforming cost centres (from expense reports) — giving management specific, data-driven cost reduction targets.
Can I access VendorKeeper analytics from my phone? Yes. VendorKeeper's dashboard is fully accessible via the Android app and web browser on any mobile device — anywhere in the world.